A new R package facilitates the generation of flowcharts for research studies
Representing the pathway of participants in a study is a key element in clinical and epidemiological research. Flow diagrams are the standard tool to do so, as they allow the different stages of the process to be clearly visualised, from initial selection to final analysis, following international guidelines such as CONSORT or STROBE.
However, their creation is often laborious. It usually involves manually entering data or programming complex structures, which makes reproducibility more difficult and may increase the risk of errors. To address this challenge, the Biostatistics Unit at the Germans Trias i Pujol Research Institute (IGTP) has developed flowchart, an R package that enables the simple and automated generation of flow diagrams directly from study data.
The package, available on the CRAN repository, introduces an approach that differs from traditional methods: instead of constructing the diagram manually, it allows you to create it directly from the dataset, integrating it with the working principles of the tidyverse. This makes it possible to produce clear, publication-ready diagrams in just a few steps, within a fully reproducible workflow.
The results of this development have been published in the Journal of Open Research Software (JORS). The article describes the motivation behind the package, its architecture and main features, as well as the available documentation. It also includes a practical example showing how to generate a complete participant flow diagram from a dataset, with the automatic calculation of numbers and percentages at each stage of the process.
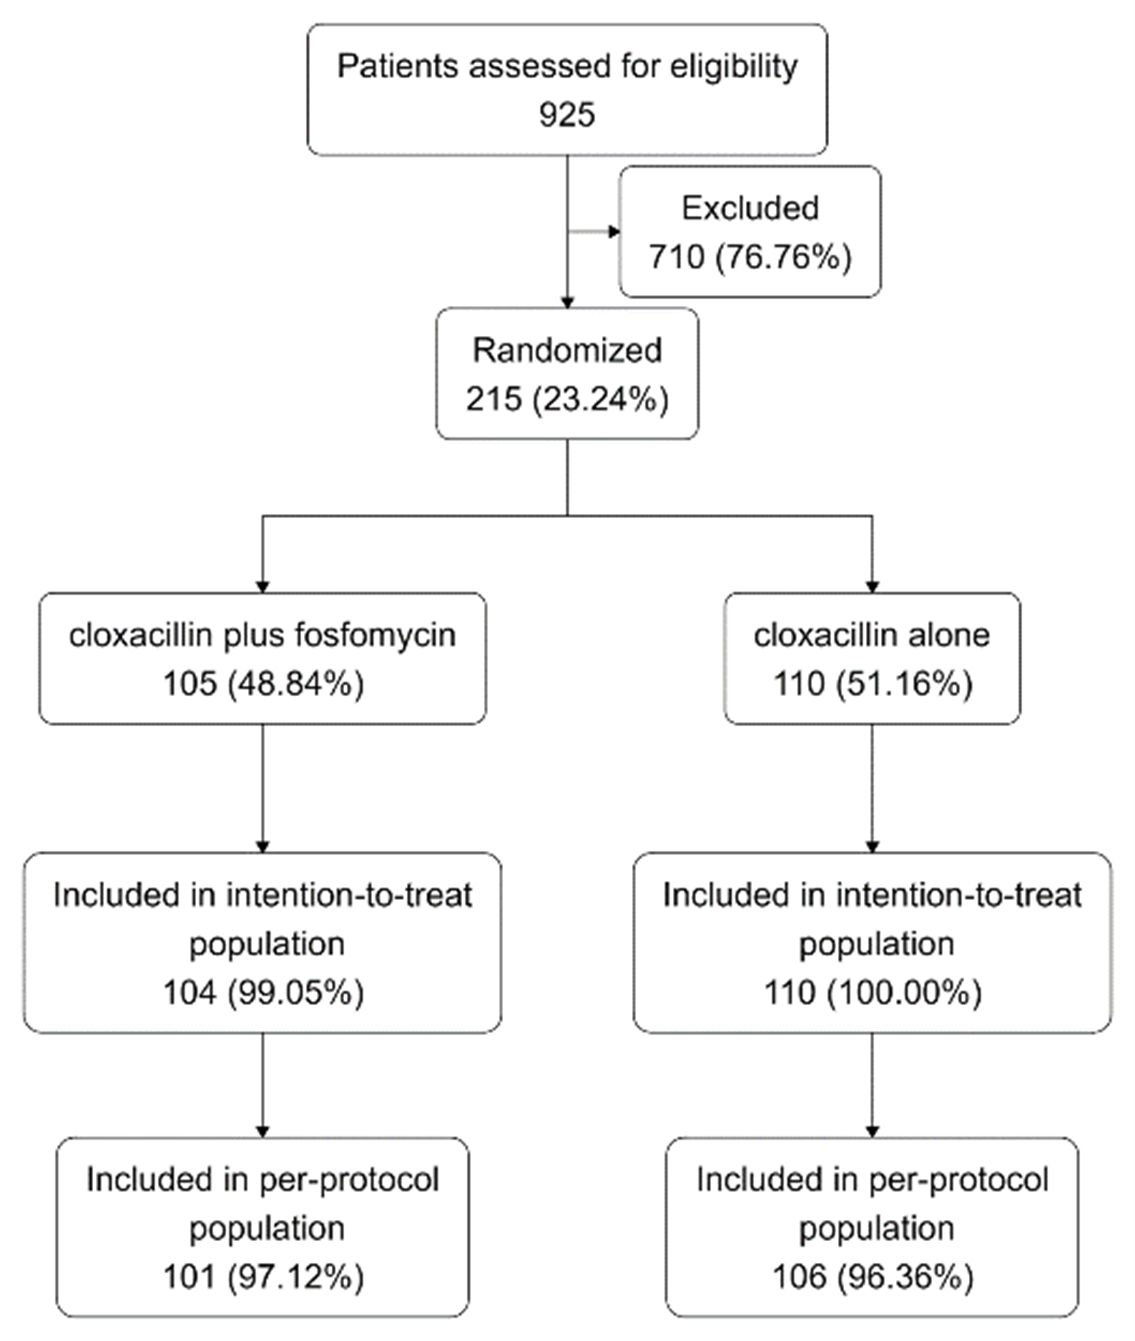
From a technical perspective, flowchart is structured around a set of functions that can be combined within the usual tidyverse workflow in R through the use of the pipe. These functions allow users to initialise the diagram, filter data, split cohorts, and customise its design, ultimately producing a final representation that can be exported in various image formats. This flexibility makes it easy to adapt the diagrams to different study designs, from clinical trials to observational studies.
According to the authors, this tool helps improve the quality of scientific reporting by facilitating the creation of coherent, transparent, and easily reproducible diagrams. Moreover, although it has been developed primarily for clinical studies, its general approach makes it applicable to a wide range of data-driven research fields.
"With flowchart, we aim to simplify a manual and repetitive process, and make it easier for researchers to generate flow diagrams directly from their data in a fast, reliable, and reproducible way" explains Pau Satorra, first author of the study and predoctoral researcher at IGTP.
Reference
Satorra P, Carmezim J, Pallarès N, Taylor KA, Tebé C. flowchart: An R Package for Data Flowchart Generation. J Open Res Softw. 2026;14:20. DOI: 10.5334/jors.649.